
Choosing a Student Information System (SIS) is rarely just a technology upgrade. For institutional leaders, it is a decision that shapes how teams work every day, how students experience campus life, and how confidently leadership can plan for growth. Modern systems promise efficiency and clarity, but one question always rises to the surface: how quickly will the investment pay for itself?
Calculating ROI can feel overwhelming because the impact of an SIS goes far beyond simple cost savings. It shows up in smoother workflows, fewer manual frustrations, clearer data, and more time for staff to focus on meaningful work instead of administrative bottlenecks. Without a clear framework, however, ROI discussions can quickly become abstract or overly optimistic.
This guide offers a practical, real world approach to estimating your SIS payback period.
Why Measuring SIS ROI Matters for Institutional Decision Makers
An SIS sits at the operational core of an institution, supporting admissions, registration, finance, academic management, and student services. Because of this wide reach, investments in an SIS are rarely viewed as routine technology upgrades. They are strategic decisions that require clear justification, especially when budgets are closely evaluated and competing priorities exist.
Measuring ROI helps institutional decision-makers move beyond focusing solely on upfront costs. It creates a structured way to evaluate long-term value by connecting system capabilities to outcomes such as improved administrative efficiency, stronger data accuracy, faster reporting, and better support for students and staff. When leadership teams can quantify these improvements, conversations shift away from expense and toward measurable institutional impact.
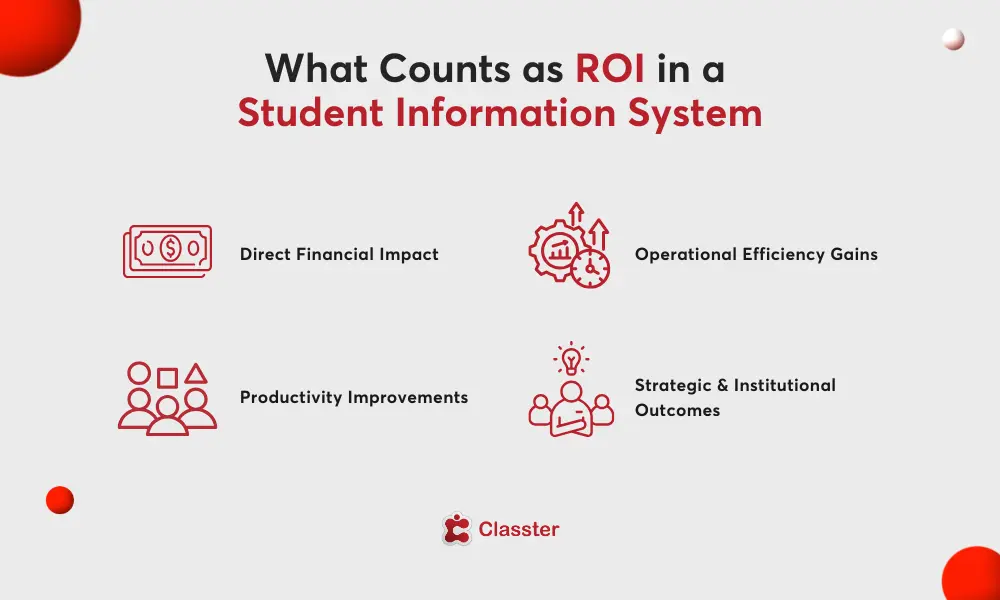
What Counts as ROI in a Student Information System
ROI in an SIS should be evaluated across several areas that reflect both financial return and institutional impact:
- Direct Financial Impact: measurable cost savings such as reduced licensing fees, lower infrastructure and maintenance expenses, and decreased reliance on manual administrative support or third-party tools.
- Operational Efficiency Gains: streamlined workflows, automated administrative processes, centralized data management, and fewer errors that reduce time spent on repetitive operational tasks.
- Productivity Improvements: better use of staff capacity, allowing teams to focus on higher value work, improve service delivery, and support growth without proportional increases in staffing.
- Strategic and Institutional Outcomes: stronger data visibility for leadership, improved compliance readiness, enhanced student experience, and better long term planning supported by accurate, real time insights.
Step by Step: How to Estimate Your SIS Payback Period
Estimating an SIS payback period does not require complex financial modeling, but it does require a structured approach grounded in realistic assumptions. Following a clear process helps institutions create an ROI estimate that leadership teams can confidently evaluate.
- Set your Payback Definition: Determine how long it will take for total benefits to equal the full SIS investment. Track this monthly or annually.
- Choose a Realistic Time Horizon: Use a realistic three to five-year window to evaluate costs and benefits.
- Calculate your Total SIS Investment: Include implementation, migration, training, internal resources, subscriptions, and ongoing operational costs.
- Baseline Current Costs: Document existing system expenses, manual processes, and staff time spent maintaining legacy workflows.
- Identify Measurable Benefits: Focus on reduced administrative time, fewer errors, faster reporting, and system consolidation.
- Assign Financial Value: Convert efficiency gains and time savings into financial impact using realistic staff cost assumptions.
- Apply Conservative Assumptions: Phase in benefits gradually and account for adoption and transition periods.
- Calculate Net Benefit: Subtract ongoing SIS costs from projected monthly or annual benefits.
- Estimate the Payback Period: Track when cumulative benefits offset the initial investment.
- Validate your Assumptions: Compare conservative and expected scenarios to ensure projections remain credible.
How Institutional Size Shapes SIS Payback and Operational Impact
A small institution with approximately 1,200 students often relies on multiple disconnected systems and manual administrative processes. Staff may spend significant time managing enrollment updates, billing adjustments, and reporting tasks across separate platforms. After implementing an SIS, even modest efficiency gains, such as reduced manual data entry and consolidated reporting, can generate measurable time savings. Because operating teams are smaller, reallocating just a few administrative hours per week can meaningfully shorten the payback period, often within the first few years.
A mid size institution with around 6,000 students typically experiences a different challenge. Operational complexity increases, integrations multiply, and reporting demands grow across departments. In this case, ROI is driven less by individual task savings and more by scale. Automation, centralized data management, and improved financial visibility reduce system maintenance effort and support larger enrollment volumes without proportional staffing increases. While implementation investment may be higher, efficiency gains compound faster, allowing payback to occur through operational scalability and improved financial control.
This comparison illustrates how SIS ROI does not depend solely on institutional size, but on how effectively operational inefficiencies are reduced and processes are standardized.
Common Pitfalls When Calculating SIS ROI
Even well intended ROI calculations can become unreliable when assumptions are overly optimistic or important factors are overlooked. Understanding common mistakes helps institutions build projections that leadership teams can trust and defend.
- Underestimating Total Costs: Many calculations focus primarily on subscription pricing while overlooking implementation effort, internal resource time, training, and transition periods. Excluding these elements often results in unrealistic payback expectations.
- Overestimating Immediate Benefits: Efficiency gains rarely appear immediately after launch. Adoption takes time, processes evolve gradually, and staff require adjustment periods before full productivity improvements are realized.
- Double Counting Benefits: Similar improvements are sometimes measured more than once. Faster processing, reduced workload, and improved productivity may represent the same operational gain if not clearly separated.
- Ignoring the Cost of the Status Quo: Legacy systems often carry hidden costs such as manual workarounds, reporting delays, and ongoing maintenance. Failing to quantify these weakens the overall ROI comparison.
- Assuming Full Adoption Too Quickly: ROI models that assume instant organization wide usage rarely reflect reality. Departments adopt new workflows at different speeds, which affects when benefits materialize.
- Focusing Only on Short Term Savings: Limiting ROI to immediate financial reductions overlooks strategic outcomes such as better data visibility, compliance readiness, and improved student experience that influence long term institutional performance.
Try the ROI Calculator
Estimating ROI manually provides valuable insight, but using a structured calculator helps institutions translate assumptions into measurable outcomes more quickly. The Classter revenue framework connects operational activity, academic changes, and financial processes in one unified environment, allowing institutions to see how student lifecycle events directly influence revenue performance and efficiency.
FAQ’s
Most institutions reach SIS payback within three to five years. The exact timeline depends on institutional size, operational inefficiencies, and how many legacy systems are replaced. Institutions with fragmented workflows and heavy manual processes often achieve faster ROI because efficiency gains are more immediate and measurable.
The largest ROI drivers include reducing manual administrative work, consolidating multiple systems, improving reporting efficiency, and avoiding additional staffing as enrollment grows. Replacing legacy infrastructure and improving financial visibility also contribute significantly to long-term returns.
Classter replaces disconnected systems with a single integrated platform that manages admissions, academics, finance, and student records. By eliminating duplicate data entry, reducing system maintenance, and improving operational visibility, institutions can achieve measurable efficiency gains that accelerate ROI.