


Most schools don’t have a retention problem. They have a visibility problem.
The data that would have flagged a struggling student three weeks of patchy attendance, a missed payment instalment, a gradebook that’s been quiet for a month existed in the system the whole time. It just wasn’t connected. By the time a teacher raised the concern or a parent missed a second call, the student was already halfway out the door.
Student retention is one of the most discussed challenges in education administration, and one of the least well-solved. Institutions invest in student support services, counselling teams, and outreach programmes. What they invest in far less often is the administrative data infrastructure that would tell them which students need those services, when they need them, and why.
This article is about that infrastructure. Specifically, how schools can connect the data they already collect attendance records, grade trends, payment status, engagement signals, and student profile information into an early-warning picture that surfaces problems before they become withdrawal decisions.
Why Retention Strategies Fail Without Data Integration
The pattern is familiar. A student starts missing classes. At first, it looks like a scheduling issue. Then grades begin to slip not dramatically, but consistently. A payment instalment is delayed. The student stops submitting work through the learning platform. Each of these signals sits in a different system, visible to a different member of staff, interpreted in isolation.
No single signal crosses the threshold that would prompt a formal intervention. Together, they tell a clear story. But without a system that connects them, no one reads that story until it’s too late.
In many institutions, one in three first-year students or more won’t return for their second year, with reasons ranging from financial pressures to academic struggles and loneliness. The complexity of this challenge is precisely why piecemeal approaches pastoral teams working from gut instinct, tutors flagging concerns mid-semester so often fall short.
What changes the odds is not more staff or more programmes. It’s earlier, more accurate information. And that information is already sitting in your administrative systems.
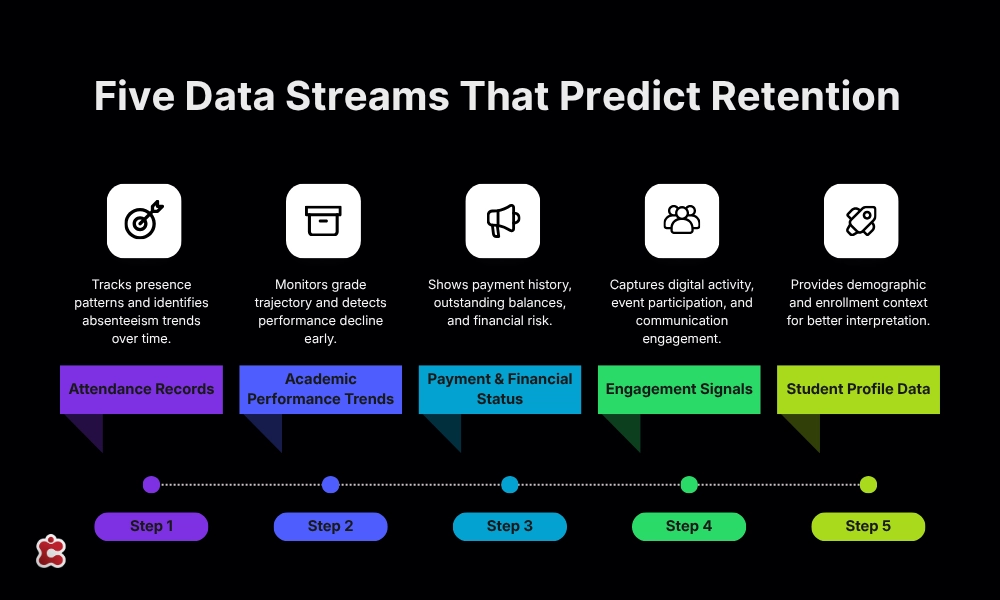
The Five Data Streams That Predict Retention
Every school collects this data. Very few schools connect it. Here’s what each stream tells you and what it misses when viewed in isolation.
1. Attendance Records
Attendance is one of the strongest single predictors of student outcomes. Prior research consistently shows that attendance is one of the best predictors of course grades and student outcomes overall. But attendance data on its own has a significant limitation: it tells you that a student is absent, not why.
A student missing Monday mornings for three consecutive weeks might be struggling with transport, dealing with a family situation, or simply disengaged from a course they find irrelevant. The intervention for each of those scenarios is completely different. Attendance data becomes useful for retention when it’s combined with other signals that help distinguish between circumstantial absences and systemic disengagement.
The other limitation is timing. Many schools only review attendance data in aggregated form weekly summaries, end-of-term reports. By the time chronic absenteeism shows up in a report, the pattern has been established for weeks. Districts using systematic approaches to attendance with consistent communication protocols and data-driven identification of at-risk students achieve meaningfully lower chronic absenteeism rates than the national average. The difference is not the data itself; it’s the speed and consistency with which it’s acted on.
2. Academic Performance Trends
Grade data is another obvious retention signal but again, the way most schools use it reduces its value significantly.
A single low mark is noise. A trend of declining performance across multiple assessments is a signal. A student who was performing in the top third of their cohort and has slipped to the bottom third over six weeks is experiencing something that warrants a conversation. A student who stopped submitting work entirely two weeks ago but hasn’t been flagged as absent may be technically enrolled but effectively gone.
The value of grade analytics for retention is in trend detection, not point-in-time snapshots. This requires a gradebook that stores longitudinal data and can surface directional changes not just current averages.
3. Payment and Financial Status
Financial pressure is one of the most significant drivers of student withdrawal, and one of the least visible to the academic staff who are usually closest to the student. Research data shows that nearly 60% of students have considered dropping out due to financial stress, and 19% actually left, primarily citing financial uncertainty.
Payment data whether a student has missed an instalment, requested a deferral, or has an outstanding balance is typically managed by a finance team with limited connection to pastoral or academic workflows. A student who is two months behind on fees and showing attendance problems is at significantly higher risk than either signal alone would suggest. But if those two data points live in separate systems and are reviewed by different teams, the connection is never made.
4. Engagement Signals
Engagement data is newer and less consistently tracked than attendance or grades, but its predictive value is increasingly well-established. When event attendance records and digital activity are connected with student information systems, patterns emerge that reveal which activities most strongly predict retention for different student populations.
Engagement signals can include: login frequency and activity on the learning management system, participation in extracurricular activities, response rates to communications from the school, and usage of support services. A student who was logging into the platform daily and has gone quiet is displaying a different pattern from a student who never engaged heavily with digital tools. The baseline matters.
The challenge is that engagement data tends to be fragmented LMS logs in one system, communication records in another, extracurricular participation tracked in a spreadsheet somewhere. Connecting it into a coherent picture requires either integration between systems or a unified platform that captures all of it natively.
5. Student Profile Data
Profile data demographic information, programme of study, year of enrolment, whether a student is full-time or part-time, whether they’re a first-generation student doesn’t predict risk on its own. But it provides essential context for interpreting the other signals.
A first-year student showing early attendance problems may be adjusting to new routines and benefit from early pastoral contact. A final-year student with the same attendance pattern but no grade deterioration might be managing work commitments without academic impact. The intervention that’s appropriate for one is inappropriate for the other. Profile data is what makes it possible to distinguish between them.
What an Integrated Retention View Looks Like in Practice
The goal is not to build a surveillance system. It’s to give the right people the right information at the right time, so that interventions can be proactive rather than reactive.
In practical terms, this means a dashboard accessible to tutors, pastoral leads, and administrators that surfaces students who have crossed a configurable threshold on multiple indicators simultaneously. Not a student who missed one class. A student who has missed three consecutive classes, whose grade trend is declining, and who has an outstanding payment query open.
| Signal | Alone | Combined |
| Missed classes × 3 | Low concern | High concern |
| Declining grade trend | Medium concern | High concern |
| Overdue payment instalment | Finance team aware | Cross-team alert |
| Reduced LMS activity | Not typically tracked | Confirms pattern |
That student gets a proactive contact from a named person a tutor, a student support officer before they make a withdrawal decision. The contact isn’t a chase for payment or a reprimand for absence. It’s a check-in. Do you need support? Is there anything we can help with? That conversation, at the right moment, changes outcomes.
When one university implemented predictive analytics to connect student data and alert advisers to early warning signs, its retention rate rose by 8.3 percentage points in the first year alone. The intervention wasn’t dramatic. It was earlier.
The Data Quality Problem Nobody Talks About
There’s an uncomfortable truth at the centre of any discussion about using administrative data for retention: in most schools, the data quality isn’t good enough to rely on.
Student records are incomplete. Attendance is logged inconsistently between staff members. Grade data is entered with delays. Payment records are maintained in a separate system that syncs with the SIS only occasionally. Profile data hasn’t been updated since the student enrolled.
For many districts, the first real insight gained from a new data visualisation tool is actually that they have a data quality problem the gaps and inconsistencies in their records that were always there but never visible before.
This is not an argument against using data for retention. It’s an argument for treating data quality as a precondition, not an afterthought. The summer period when student records are between academic cycles is the best opportunity most schools have to audit and clean their data before the next year begins.
Specifically, this means:
- Completing and standardising student profiles so that enrolment status, contact details, and programme information are accurate across all modules
- Establishing consistent attendance logging protocols so that the data entering the system reflects reality rather than administrative gaps
- Reconciling financial records so that payment status is current and accurate in the system that staff will use for risk flagging
- Auditing LMS data to confirm that engagement metrics are actually being captured and are meaningful
Schools that have a student information system as a central record should use that system as the reference point for the audit checking whether data in other systems matches what’s in the SIS and resolving discrepancies before the new year.
How Classter Connects the Data That Retention Depends On
Classter is built on a unified data model. Every module attendance, gradebook, billing, LMS, CRM reads from and writes to the same student record. That’s the architectural decision that makes integrated retention analytics possible.
In practice, this means:
The School Management System captures daily attendance in real time, with configurable alerts when a student’s absence rate crosses a defined threshold. That alert doesn’t just go to the register it can trigger a notification to the student’s assigned tutor or pastoral lead.
The gradebook and academic reporting tools track performance longitudinally, so grade trend analysis is built in rather than requiring manual extraction. Administrators can configure dashboards that surface students whose performance trajectory has changed significantly from their baseline.
The Billing & Payments module maintains payment status in real time. Overdue invoices, deferred payments, and outstanding balances can be made visible to authorised staff in the same platform where they see attendance and grade data not in a separate finance system.
The Academic CRM allows schools to log and track all communications with students, so that support history is visible to everyone involved in a student’s care. When a tutor reaches out, the record of that contact exists and the next person who looks at the student’s file knows what’s already been tried.
Building a Retention-Focused Data Practice: Where to Start
For schools that are starting from a fragmented position, the path to better retention data isn’t a single project it’s a series of decisions about what to measure, how to connect it, and who acts on it.
Start with the data you already have. Most schools have far more relevant data than they use for retention purposes. Before investing in new tools, map what exists: where is attendance logged, where are grades stored, how is payment status tracked, what engagement data is being captured at all? The gaps will become clear.
Define what a retention risk looks like in your institution. The specific combination of signals that predicts withdrawal varies by institution type, student population, and programme. Don’t try to import a generic model work with your pastoral team and historical data to define the thresholds that matter for your students.
Assign clear ownership. Data dashboards only work if someone is responsible for acting on them. Define who receives alerts, who makes the first contact, and what the escalation path looks like when a student doesn’t respond.
Review and iterate. A retention data practice is not a one-time setup. At the end of each term, review which students were flagged, whether the flags were accurate, and whether interventions were effective. Adjust thresholds accordingly.
According to EdTech Magazine’s reporting on K–12 data analytics, combining data from multiple sources makes it possible to spot warning signs that any single system would miss but the key is making that information accessible not just to data professionals, but to the people who can actually respond to it. The student engagement benefits that matter most for retention aren’t the ones measured at the end of the year. They’re the ones that can be seen week by week and acted on before they compound into a decision to leave.
Conclusion
Retention is not a counselling problem or a student services problem. It is, at its foundation, an information problem. The students who leave do so gradually, through a series of small signals that build into a pattern a pattern that is visible only if the data is connected.
Schools that improve retention rates don’t necessarily have more staff or better programmes. They have better visibility. They know earlier which students are at risk, they have clear processes for responding, and they have the data infrastructure that makes both possible.
The data already exists. The question is whether your systems are built to surface it at the right moment before a student decides that staying is harder than leaving.Ready to see how Classter connects attendance, grades, payments, and engagement into a single retention view?
Book a demo and we’ll walk you through how it works for institutions like yours.
FAQ’s
Administrative data attendance records, grade trends, payment status, and engagement signals collectively reveals patterns that predict withdrawal risk. When these data streams are siloed across different systems and reviewed by separate teams, problems go unnoticed until they’re difficult to reverse. When connected into a unified view, the same data allows for proactive intervention weeks or months earlier.
Research consistently identifies a combination of factors rather than any single indicator. Attendance trajectory, grade trend (particularly directional change rather than absolute level), financial stress indicators such as missed payments, and reduced engagement with the learning platform together form a more reliable picture than any one metric alone. First-year students and those facing financial pressure tend to be the highest-risk groups.
Start by mapping the data you already collect and identifying where it lives. Define what combination of signals constitutes a meaningful risk flag for your institution this varies by student population and programme type. Establish who is responsible for reviewing flags and making first contact with students. Ensure your platform allows all relevant data to be viewed in one place by authorised staff, rather than requiring manual compilation from separate systems.
Yes but indirectly. Data quality doesn’t improve retention directly; it improves the accuracy of risk identification. An early warning system built on incomplete or inconsistently entered data will generate both false positives (students flagged who aren’t at risk) and false negatives (students at risk who don’t appear in dashboards). Both undermine trust in the system and reduce its effectiveness. Data quality is a precondition, not an afterthought.
This depends on the platform. A genuinely integrated school management system one where attendance, grades, billing, and engagement data all connect to a single student record can surface retention risk signals natively without requiring a separate analytics tool. The advantage of this approach is that the data is always current and doesn’t require manual exports or integration maintenance. Platforms where these functions are handled by disconnected modules or separate systems will typically require additional tooling to connect the picture.
The transition between academic years typically summer is the best window. Student records are between cycles, making it a good time to clean and standardise data. New configurations, dashboard setups, and staff training can be completed before the new cohort arrives. Establishing the infrastructure before the year begins means it’s operational from day one of enrolment, rather than being set up reactively mid-year.